| Daily Commentary |
|---|
  |
|
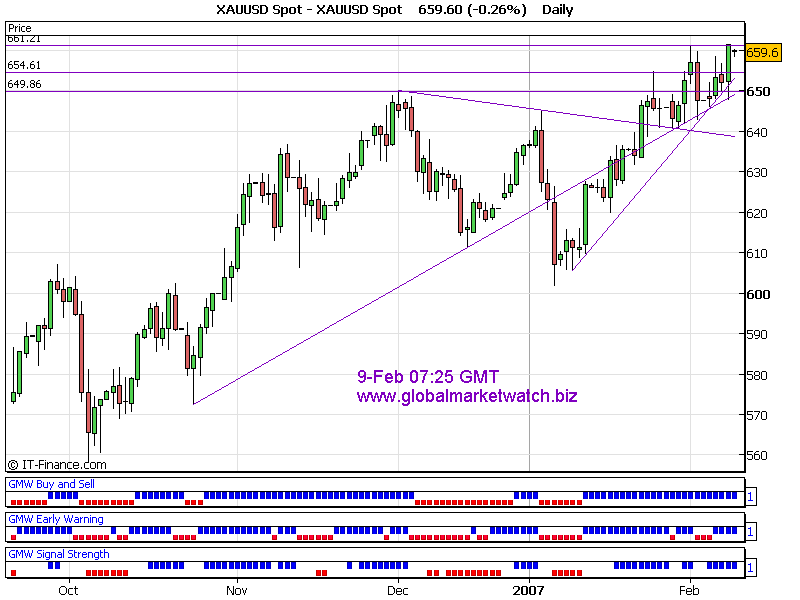
Gold fell sharply as expected during London session but unexpectedly, found support at 647 and sharply recovered during NY session and hit upside target at 661. Current resistance area is 662. Short term support will be around 656 and resistance will be around 663~665. Current trend is bullish at the time of analysis. Key levels to watch are 656 to downside and 661 to upside. Possible upside target will be around 665 and downside targets will be around 652~650. My daily indicators have been doing well since 14-Jan. It generated a Buy signal when gold was 625. If you trade medium term with wide stoploss level, GMW Buy and Sell indicator will be a reliable trend indicator. Good Luck! Thanks for listening! Gold Trader |
 |
I have also posted the signals on my main web site in the individual chart page. For subscription based analysis sample, you can find it in "Samples" page of my main website. For Elliott Wave International's Commentary, please visit here! Trading Platform to trade gold, silver and forex => Click Here |
|
|
|