| Daily Commentary | |
|---|---|
 |
|
|
|
|
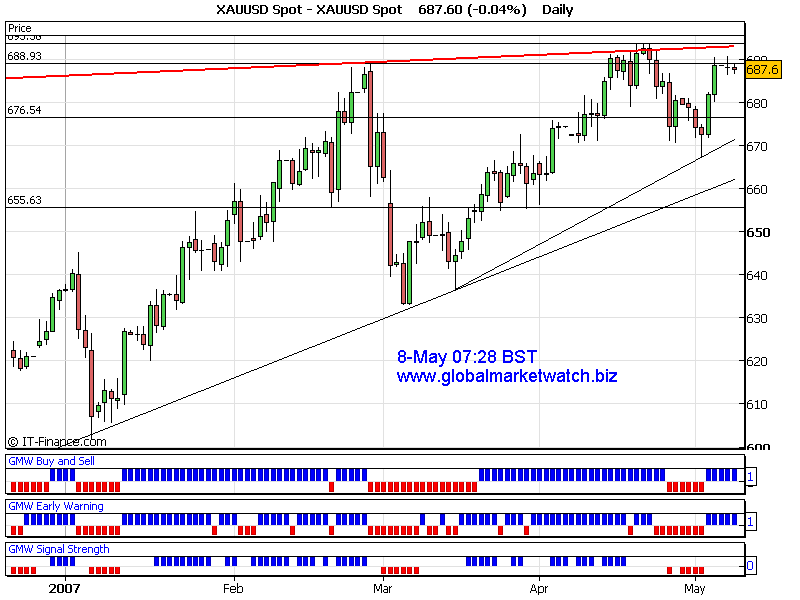
Gold was just trading in a tight range between 691 and 686 all day on Monday. Although daily indicators remain bullish, short term indicators are mixed at the time of analysis. It is much likely that gold would be trading choppily for another one day.
Current near term resistance will be around 690~691 and support area would be at 685~686. Short/Medium term resistance will be around 694 and support will be at 682. Current trend is neutral at the time of analysis. Key levels to watch are 691 as a resistance/breakout and 682~681 as a strong support. Possible upside target can be around 694 and downside target would be around 682 if near term support and resistance levels are taken out. P.s. I occasionally post daily charts with indicators on my main website. You can see some indications of trend change on the charts. If you are looking for US stock, forex and futures charts, opinions and quotes, you can visit our main website here. There are also some educational materials about futures and option tradings. (Choose "Futures 101" from "Select" box) Good Luck! Thanks for listening! Gold Trader
p.s We are arranging to give away some classic Robert Prechter's Elliott Wave Principle Books. More information will be posted on our main website soon. |
|
|
|
I have also posted the signals on my main web site in the individual chart page. For subscription based analysis sample, you can find it in "Samples" page of my main website. For Elliott Wave International's Commentary, please visit here! Trading Platform to trade gold, silver and forex => Click Here |
|
|
|