| Daily Commentary |
|---|
 |
|
|
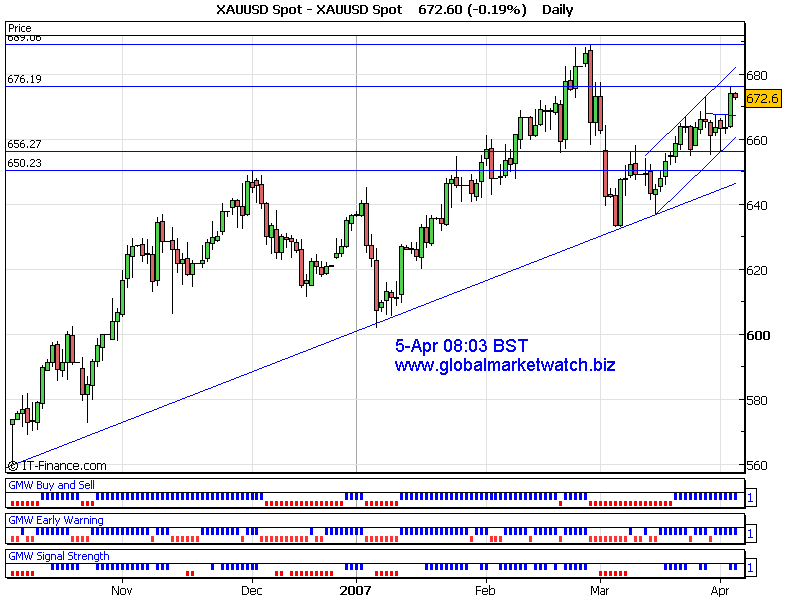
Gold came out of trading range after it clearly broke 667 yesterday and reached as high as 676. Daily and short term indicators are indicating to go higher. We would expect a more stable trading session rather than highly volatile session as Easter holidays are approaching. Current near term support will be around 670 and resistance area would be at 675. Short/Medium term support will be at 667 and resistance will be around 679~683. Current trend is bullish at the time of analysis. Key levels to watch are 670 to downside and 675 to upside. Possible upside target would be around 679 and downside target can be around 667 if near term support and resistance levels are violated. P.s. Click here for samples detailed analysis. Good Luck! Thanks for listening! Gold Trader
p.s We are arranging to give away some classic Robert Prechter's Elliott Wave Principle Books. More information will be posted on our main website soon. |
|
I have also posted the signals on my main web site in the individual chart page. For subscription based analysis sample, you can find it in "Samples" page of my main website. For Elliott Wave International's Commentary, please visit here! Trading Platform to trade gold, silver and forex => Click Here |
|
|
|