Daily Commentary and Analysis
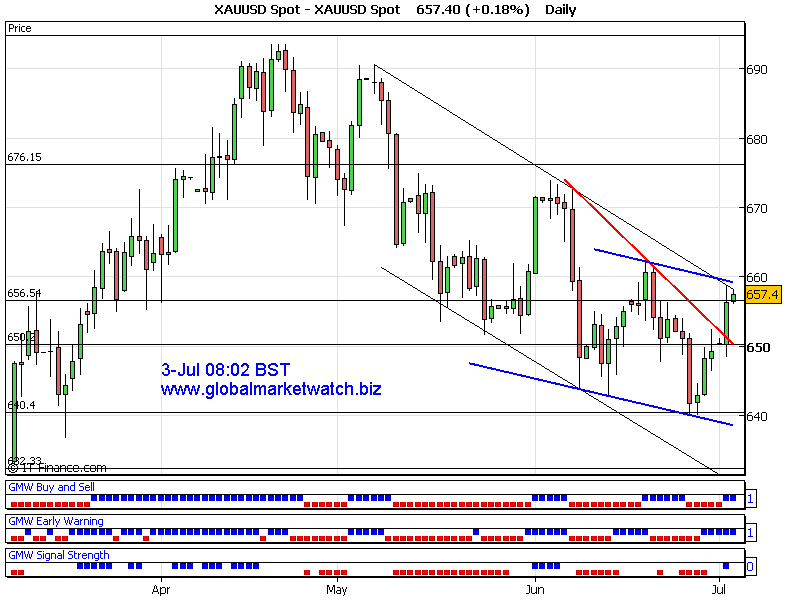
Gold came out of trading range and hit our anticipated upside target at 659 yesterday. Current daily trend and short term trend indicators are up at the time of analysis.
Current near term support will be around 654 and resistance will be around 658~659. Short/Medium term resistance is around 664~665 and support will be at 650~648.
Current trend is bullish at the time of analysis. Key levels to watch are 654 as a strong support and 658~659 as a strong resistance/breakout level towards 665 level.
Possible upside target can be around 664~665 and downside target would be around 649 if near term support and resistance levels are taken out.
Thanks for listening
Good luck
DailyCom
Technical Trading and Fibonacci
Technical analysis is a study of price patterns on charts. That includes studies of price ratios. Fibonacci is one of the interesting, well-known and commonly used analytical tools in T.A. To learn more about Fibonacci for FREE, please visit here. |