| Daily Commentary |
|---|
 |
|
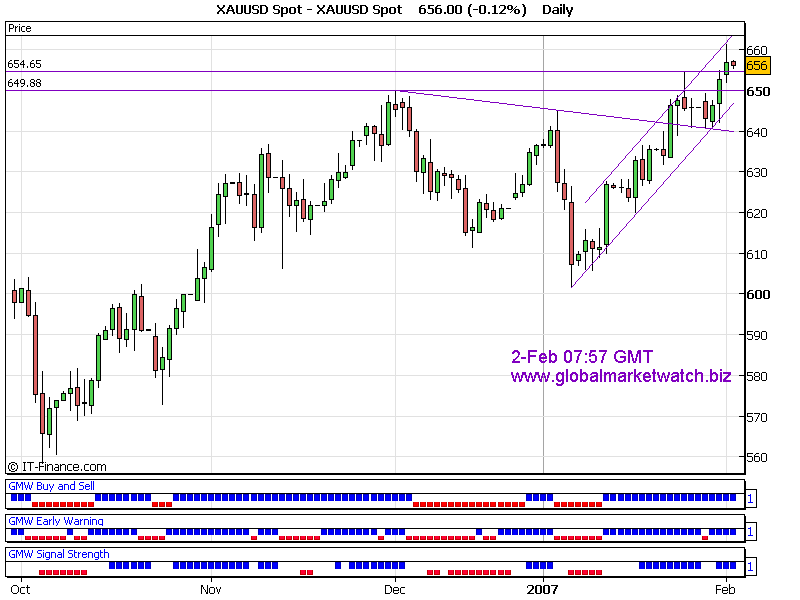
As expected ealier, gold tested 662 as high of the day yesterday and reversed to the point where it started a breakout. However, overall daily trend remained intact and indicators are showing strong up. Today near term support level is 655 and resistance is 658. Short term support will be around 650 and resistance will be around 666. Current trend is neutral at the time of analysis. Breaking above 658 would indicate further strength towards 661 area and 666 area thereafter. And breaking below 655 will signal selling towards 650~647 area. Key levels to watch are 658 to upside and 655 to downside.
Good Luck! Thanks for listening! Gold Trader I have also posted the signals on my main web site in the individual chart page. For subscription based analysis sample, you can find it in "Samples" page of my main website. For Elliott Wave International's Commentary, please visit here! |
|
|
|