 |
|---|
 |
|
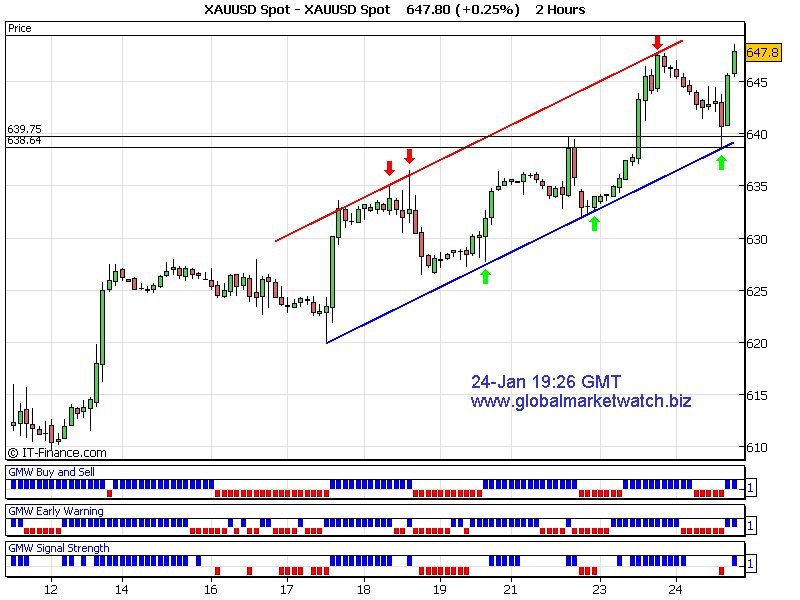
Why 639~640~642 area would have been a buying zone on 24-Jan? In 2h chart, trend channel has formed a few days ago. In uptrends, lower channel lines are normally buying areas and upper channels are normall selling areas. As soon as market is coming down, all of us (including me) are scared to death if it is going to fall more. If we don't have any analysis before the fall we won't know where it would stop falling. As I discussed earlier, by entering around support (pre-identified buying zone) risk is normally low and reward is always high as you can see today. The trick is, to identify the potential buying and selling zone. After we identify the zone, we can use the following strategies. Click here to download a PDF file. To identify potential buying and selling zones, we use various techniques and calculations. And we also have to confirm the results with different analytical methods. When we use many different methods, the results become confusing. So, I developed and use my own technical indicators most of the time. I would say most of the time. Because, sometime, indicators on different timeframe charts would show different indications. We need to gauge which one would be stronger than other. Technical analysis works most of the time. All we have to do is, we have to believe that it works and follow whether profitable or not.
Good Luck! Thanks for listening! Gold Trader p.s I have also posted the signals on my main web site in individual chart page |
|
|
|