| Daily Commentary |
|---|
 |
|
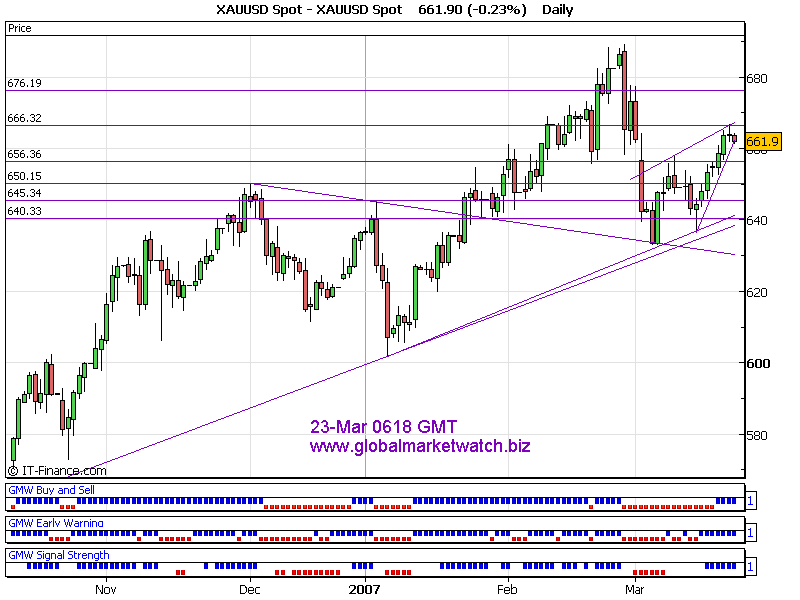
Gold reached a resistance level at 667. Based on daily chart indicators, current trend is strong up. However, based on short term indicators, it is indicating that market would probably pause its rally. Current near term strong resistance area would be at 664 and support will be around 661. Short/Medium term support will be around 656 and strong resistance will be around 667. Current trend is slightly bearish at the time of analysis. Key levels to watch are 660 to downside and 664 to upside. Possible downside target can be around 656 and upside target would be around 667. However, I believe that upside price movement will be limited today. Good Luck! Thanks for listening! Gold Trader
p.s We are arranging to give away some classic Robert Prechter's Elliott Wave Principle Books. More information will be posted on our main website soon. |
|
I have also posted the signals on my main web site in the individual chart page. For subscription based analysis sample, you can find it in "Samples" page of my main website. For Elliott Wave International's Commentary, please visit here! Trading Platform to trade gold, silver and forex => Click Here |
|
|
|