Daily Commentary and Analysis
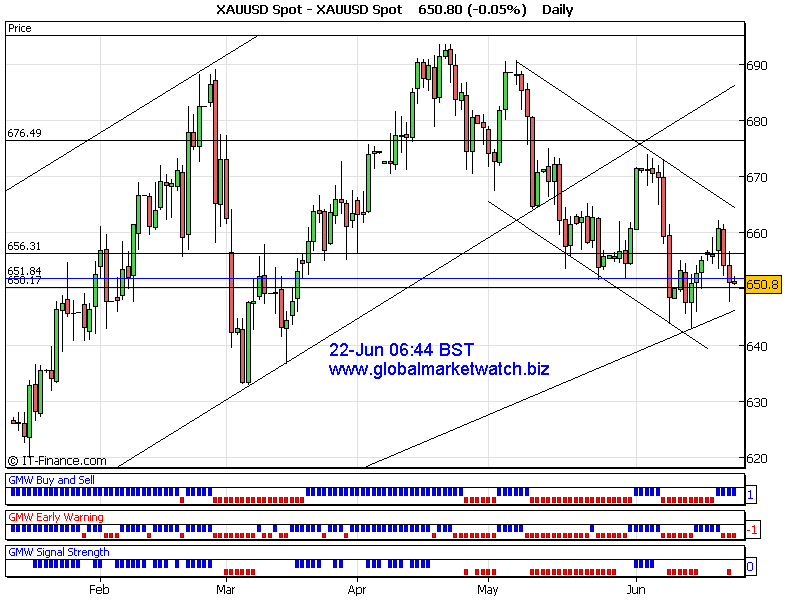
There was another round of sell off after gold was rejected from 656 level and hit daily downside target at 648. Although daily trend indicator is up, some short term indicators are mixed at the time of analysis.
Current near term support will be around 648 and resistance will be around 652. Short/Medium term resistance around 657 and support will at 643~645.
Current trend is neutral at the time of analysis. Key levels to watch are 652 as a resistance/breakout towards 657~660 area and 648 as a strong support.
Possible upside target can be around 657~660 and downside target would be around 645~643 if near term support and resistance levels are taken out.
Thanks for listening
Good luck
DailyCom
Technical Trading and Fibonacci
Technical analysis is a study of price patterns on charts. That includes studies of price ratios. Fibonacci is one of the interesting, well-known and commonly used analytical tools in T.A. To learn more about Fibonacci for FREE, please visit here. |