Daily Commentary and Analysis
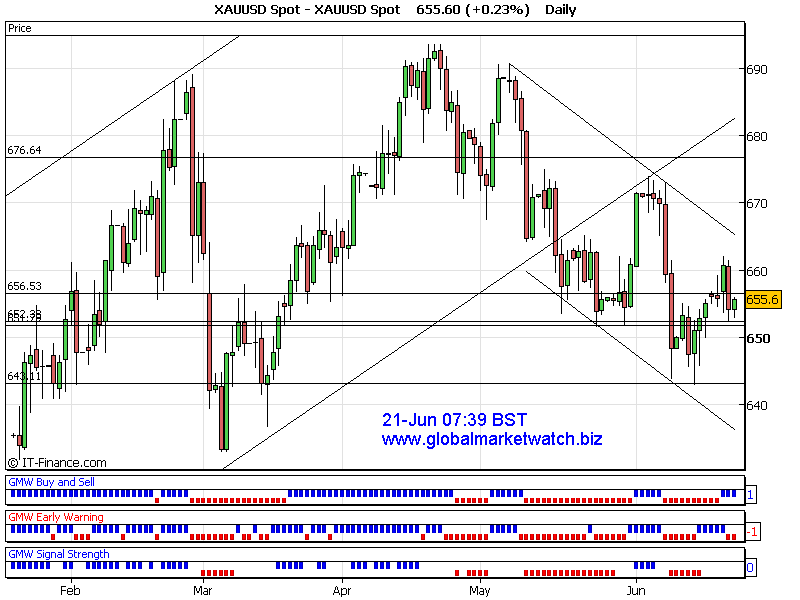
Gold was sold off yesterday at a resistance level around 662. Current daily trend is up and some short term indicators are mixed at the time of analysis.
Current near term support will be around 652~650 and resistance will be around 656. Short/Medium term resistance around 659~662 and support will at 650~648.
Current trend is slightly bearish at the time of analysis. Key levels to watch are 656 as a resistance/breakout towards 660 area and 652~650 as a strong support.
Possible upside target can be around 660~662 and downside target would be around 650~648 if near term support and resistance levels are taken out.
Thanks for listening
Good luck
DailyCom
Technical Trading and Fibonacci
Technical analysis is a study of price patterns on charts. That includes studies of price ratios. Fibonacci is one of the interesting, well-known and commonly used analytical tools in T.A. To learn more about Fibonacci for FREE, please visit here. |