| Daily Commentary |
|---|
 |
|
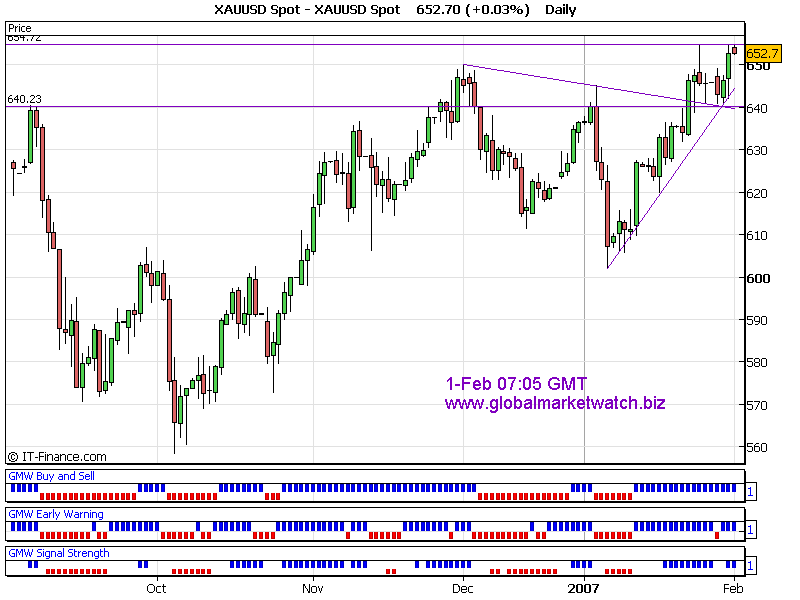
Gold came out of trading range after violation of 648 to upside and the shooting star pattern became invalidated. All the indicators are a showingl strong uptrend. Surprisingly, gold broke out before the FOMC interest rate decision and no reaction at the time of report. Today near term strong support level is 651 and resistance is 655. Short term support will be around 645 and resistance will be around 659~ 662. Current trend is bullish at the time of analysis. Breaking above 655 would indicate further strength towards 660 area. Key levels to watch are 655 to upside and 649 to downside.
Good Luck! Thanks for listening! Gold Trader I have also posted the signals on my main web site in the individual chart page. For subscription based analysis sample, you can find it in "Samples" page of my main website. For Elliott Wave International's Commentary, please visit here! |
|
|
|