Daily Commentary and Analysis
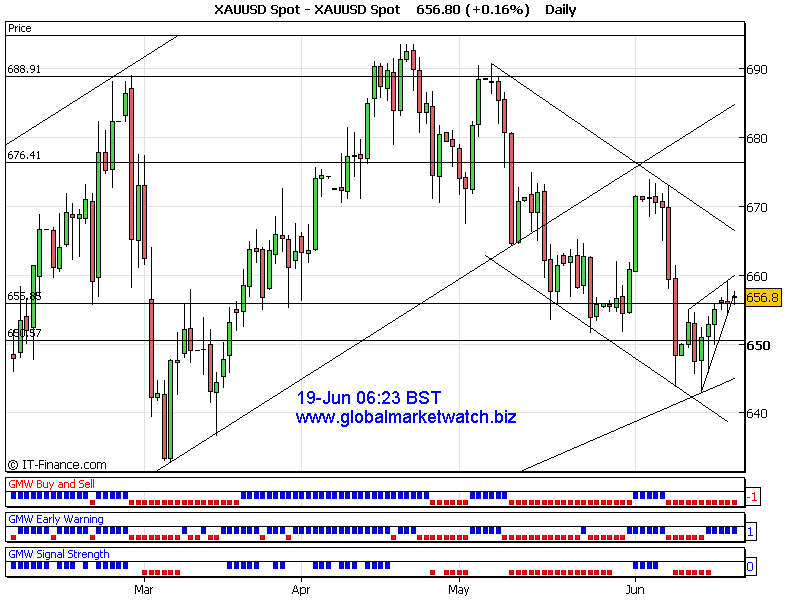
As we expected, gold was rejected from 660 area as a strong resistance area. Current daily trend is still down. Based on candlestick patterns and short term indicators, market would be moving strongly in either direction today.
Current near term resistance will be around 659~660 and support will be around 656. Short/Medium term resistance around 662~664 and support will at 651~648.
Current trend is neutral at the time of analysis. Key levels to watch are 659~660 as a strong resistance area and 656 as a weak support.
Possible downside target can be around 651~648 and upside target would be around 659~662 if near term support and resistance levels are taken out.
Thanks for listening
Good luck
DailyCom
Technical Trading and Fibonacci
Technical analysis is a study of price patterns on charts. That includes studies of price ratios. Fibonacci is one of the interesting, well-known and commonly used analytical tools in T.A. To learn more about Fibonacci for FREE, please visit here. |