 |
|---|
|
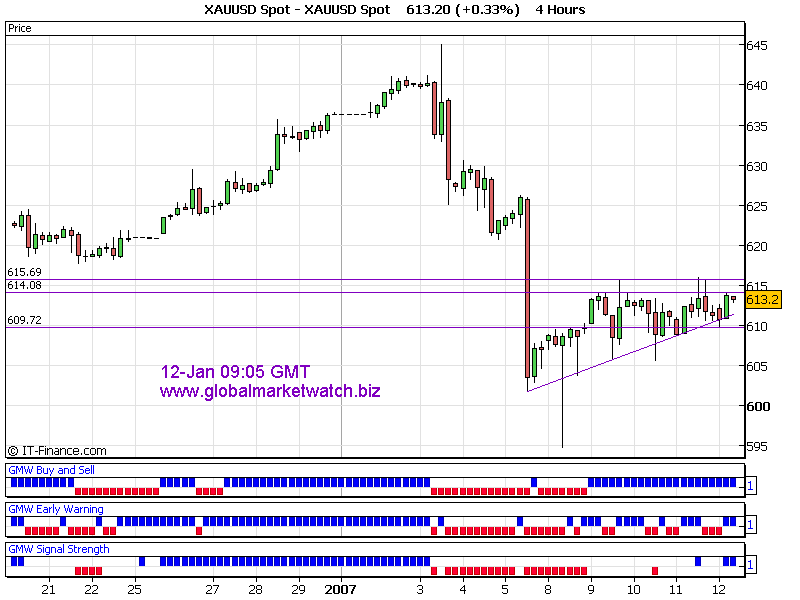
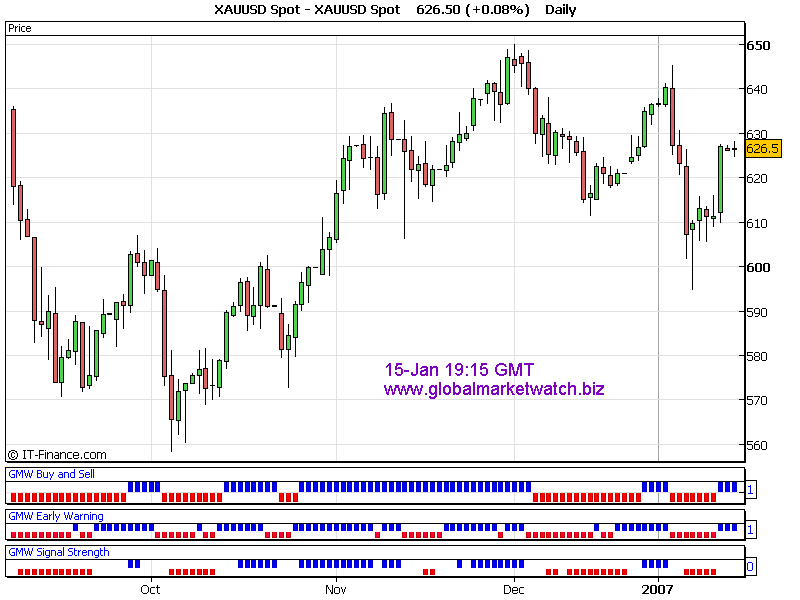
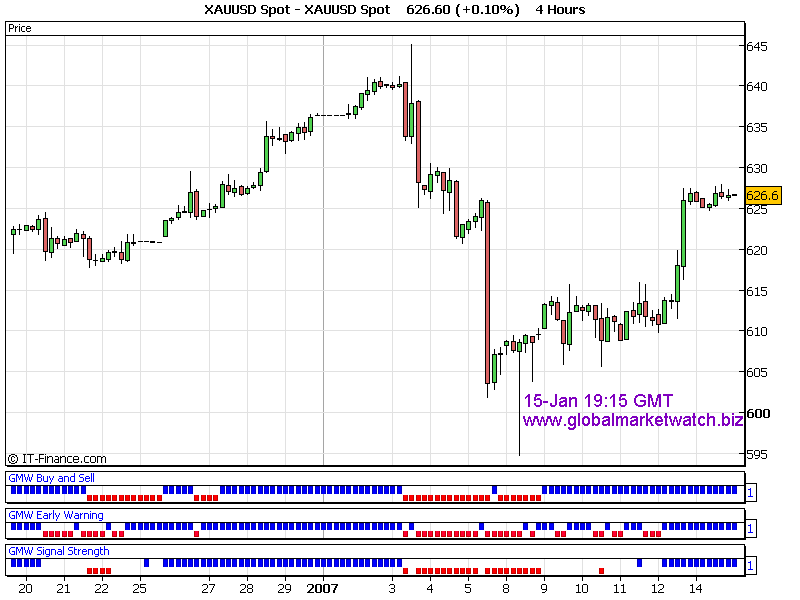
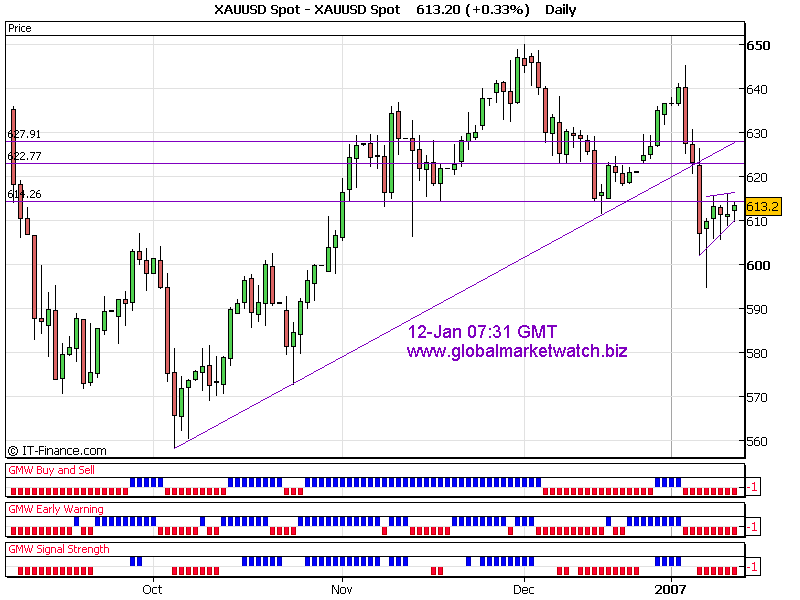
Gold broke out to upside as expected on Friday morning. Technically, in 4h chart, the indicators had been signalling to buy. Before market broke the critical resistance level at 615~616, signal strength indicator in 4h turned blue. It rarely show red or blue during past week's choppy trading days. It was showing possible direction of breakout on Friday. Take a look at the charts. They are daily chart and 4h chart for 12-Jan and 15-Jan.
Currently, daily buy/sell indicator has turned to buy. Is it going to be a reliable signal? We won't be sure. But normally, indicators show better acuracy than human interpretation on price. I would try to apply Elliott Wave Principle for this breakout event. I think some of us would have been very bearish before the breakout. Elliott Wave theory reflect the market participants' psychology and can predict the direction of breakout and how investors would react on current price. You can download FREE independent investor eBook from above banner. In my opinion, around 602 would be end of "C" wave. If it is true, gold would resume its uptrend from now on. If you also find out the relation between Elliott Wave and recent gold breakout, please let me know by email. Good Luck! Thanks for listening! Gold Trader |
|
|
|