| Daily Commentary |
|---|
 |
|
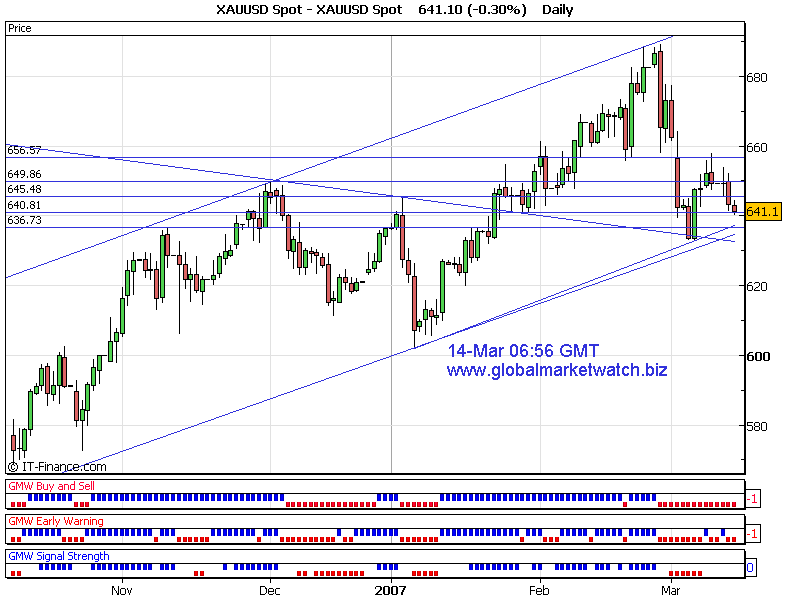
Gold has been consolidating for a few days by now. Based on daily chart indicators, it is still in downtrend but the strength of current fall has been deaccelerating. Current near term strong support area would be at 640~639 and strong resistance will be around 646. Short/Medium term resistance will be around 649 and strong support will be around 634. Current trend is bearish at the time of analysis. Key levels to watch are 640 to downside and 646 to upside. Possible upside target can be around 649 and downside target can be around 634. I believe around 634 area would be a low risk buying area as there are strong support levels are lying. Good Luck! Thanks for listening! Gold Trader
p.s We are arranging to give away some classic Robert Prechter's Elliott Wave Principle Books. More information will be posted on our main website soon. |
|
I have also posted the signals on my main web site in the individual chart page. For subscription based analysis sample, you can find it in "Samples" page of my main website. For Elliott Wave International's Commentary, please visit here! Trading Platform to trade gold, silver and forex => Click Here |
|
|
|