| Daily Commentary |
|---|
  |
|
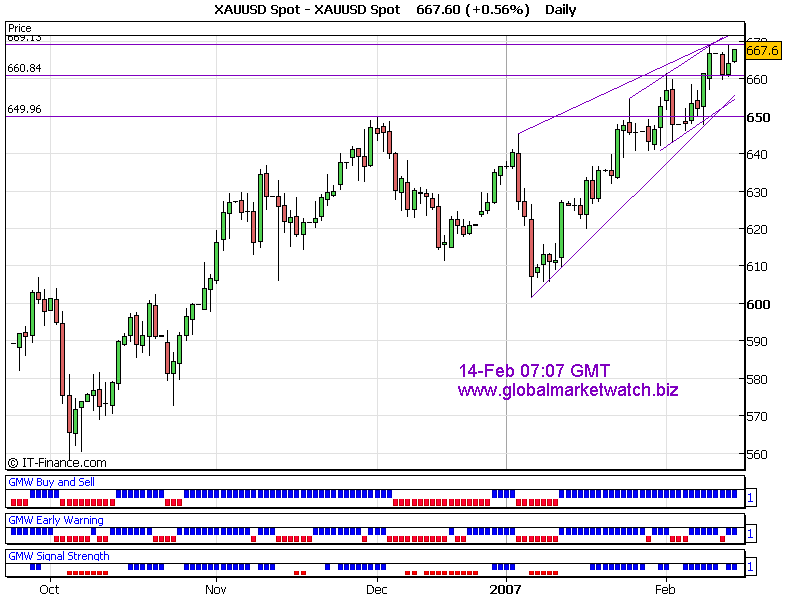
Gold rallied and reversed at the strong resistance 669. We might have to be aware that 669~670 area is a strong resistance area and gold never closed above 670 in last 9 months. Based on my indicators, gold is in strong bull run and it is likely to break 669~670 level today. Current near term resistance area would be at 669. Short term support will be around 664 and resistance will be around 674. Current trend is quite bullish at the time of analysis. Key levels to watch are 669 to upside and 663 to downside. Possible upside target will be around 674~676 and downside targets will be around 659~657. Good Luck! Thanks for listening! Gold Trader |
 |
I have also posted the signals on my main web site in the individual chart page. For subscription based analysis sample, you can find it in "Samples" page of my main website. For Elliott Wave International's Commentary, please visit here! Trading Platform to trade gold, silver and forex => Click Here |
|
|
|