| Daily Commentary |
|---|
 |
|
|
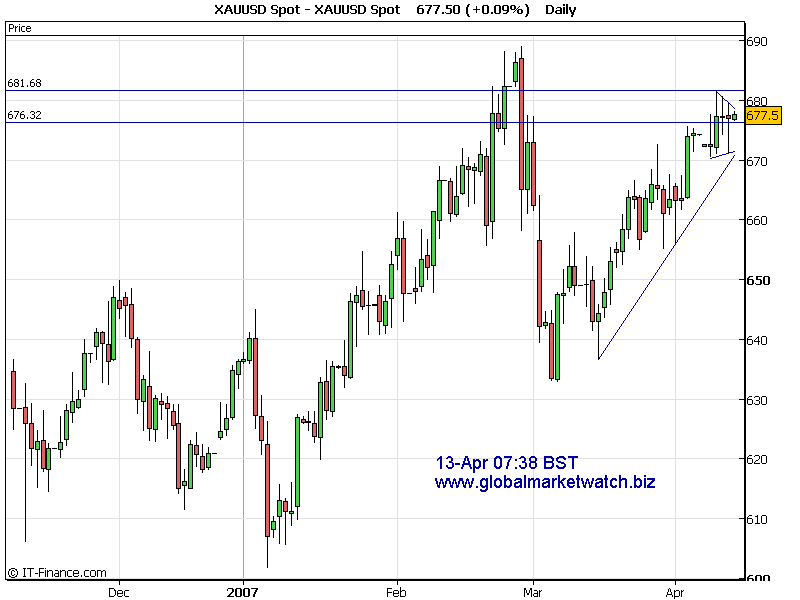
Gold momentarily broke down below the triangle formation and came back into 672~680 trading range. Daily and short term trends are showing strong up at the time of analysis. Current near term support will be around 676 and strong resistance area would be at 679. Short/Medium term resistance will be at 685 and strong support will be around 672. Current trend is bullish at the time of analysis. Key levels to watch are 679 to upside and 672 to downside. Possible upside target would be around 685~688 and downside target can be around 667 if near term support and resistance levels are violated. P.s. If you are looking for US stock, forex and futures charts, opinions and quotes, you can visit our main website here. There are also some educational materials about futures and option tradings. (Choose "Futures 101" from "Select" box) Good Luck! Thanks for listening! Gold Trader
p.s We are arranging to give away some classic Robert Prechter's Elliott Wave Principle Books. More information will be posted on our main website soon. |
|
I have also posted the signals on my main web site in the individual chart page. For subscription based analysis sample, you can find it in "Samples" page of my main website. For Elliott Wave International's Commentary, please visit here! Trading Platform to trade gold, silver and forex => Click Here |
|
|
|