| Daily Commentary |
|---|
 |
|
|
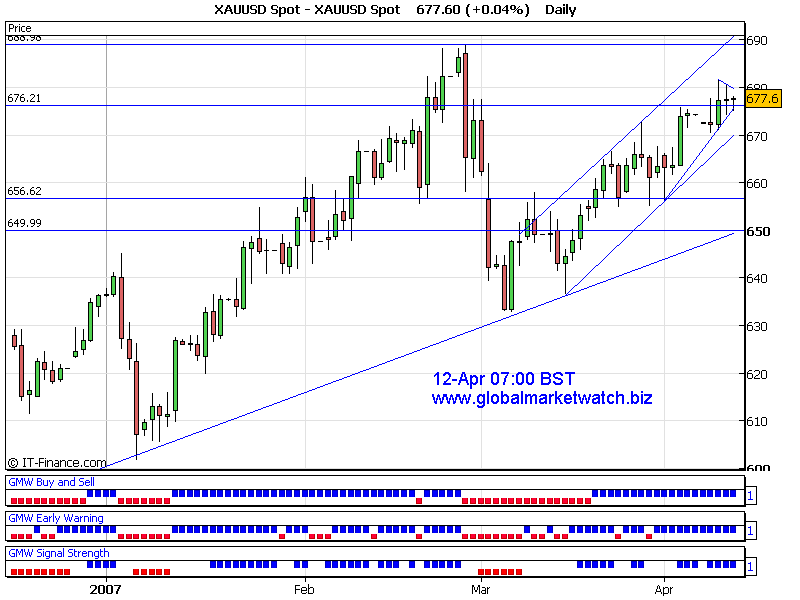
As I expected yesterday, gold tested the strong resistance and intraday high at 680. Daily trend and short term trend remain bullish. Based on previous days' bar pattern, market is coiling and preparing for another strong move. But I believe market is in a overbought condition and we would see some reactions. However, upper and lower boundary of the triangle are good places to watch for a breakout move. Current near term support will be around 674 and strong resistance area would be at 680. Short/Medium term resistance will be at 685~688 and support will be around 667. Current trend is slightly bullish at the time of analysis. Key levels to watch are 674 to downside and 680 to upside. Possible downside target can be around 667 and upside target would be around 685 if near term support and resistance levels are violated. P.s. If you are looking for US stock, forex and futures charts, opinions and quotes, you can visit our main website here. There are also some educational materials about futures and option tradings. (Choose "Futures 101" from "Select" box) Good Luck! Thanks for listening! Gold Trader
p.s We are arranging to give away some classic Robert Prechter's Elliott Wave Principle Books. More information will be posted on our main website soon. |
|
I have also posted the signals on my main web site in the individual chart page. For subscription based analysis sample, you can find it in "Samples" page of my main website. For Elliott Wave International's Commentary, please visit here! Trading Platform to trade gold, silver and forex => Click Here |
|
|
|