Technical Review on Recent Deep Decline
As we all know that gold was sold off deeply in two days, we will need to review if there was any signal before the fall.
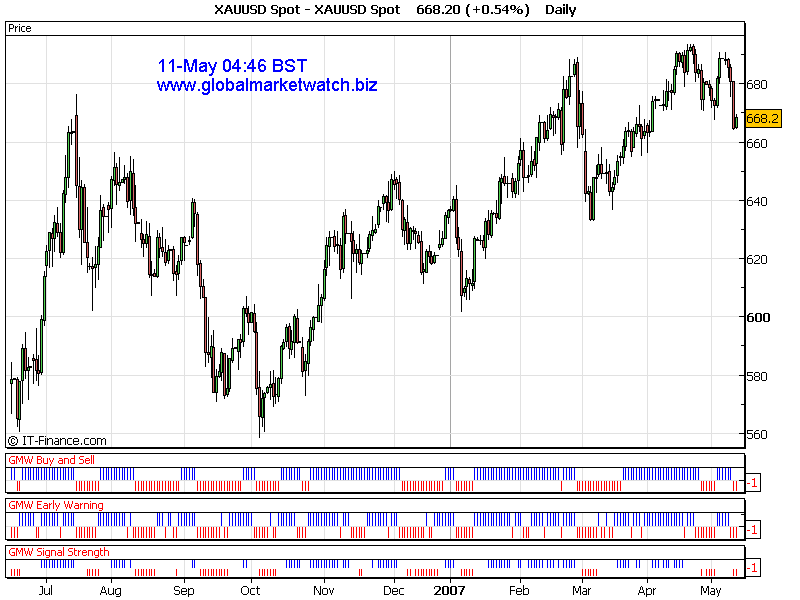
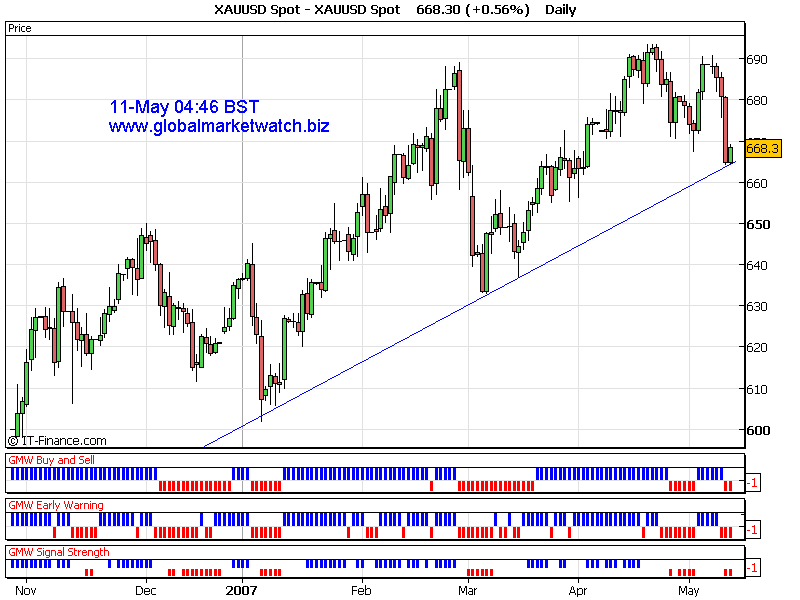
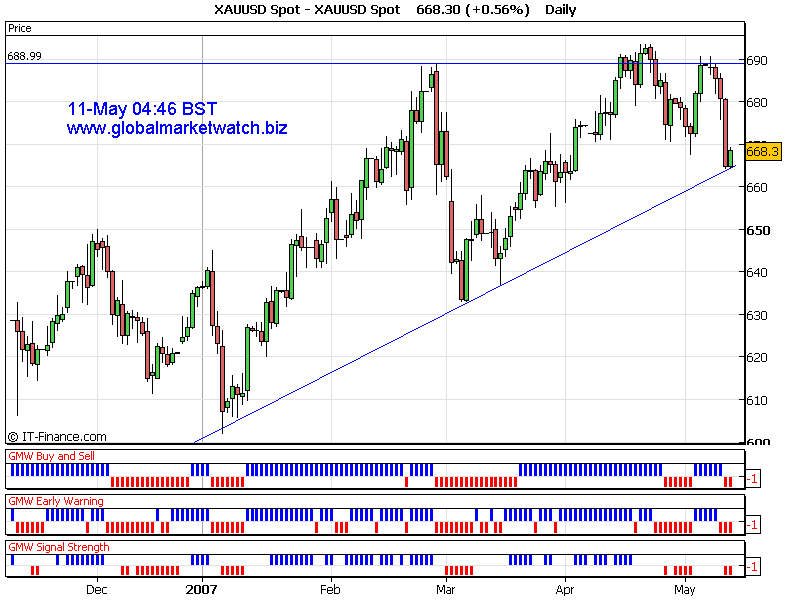
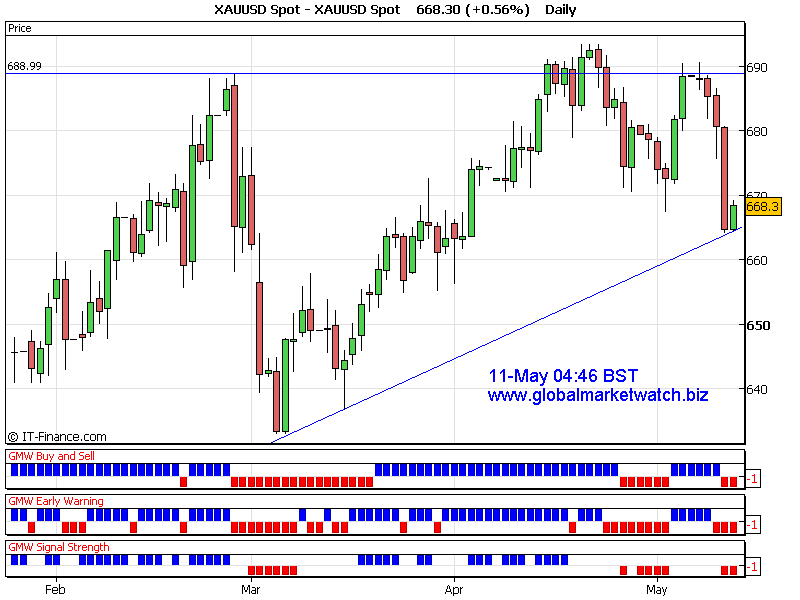
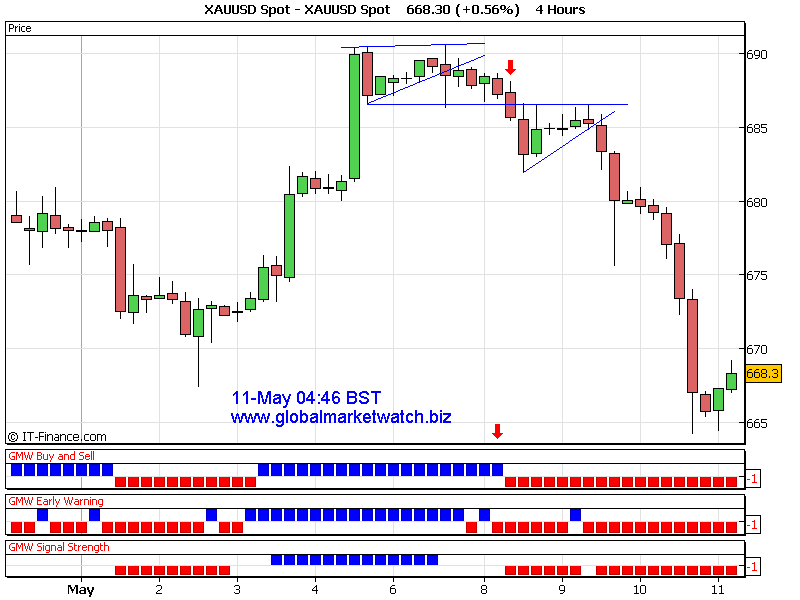
If we carefully look at daily charts, gold struggled to break through 689 level and did not close above that level.
On 7-May, there was a small doji form the top of the chart. It is normally a sign of trend change.
Gold continued falling for two days and found the daily support around 664 on 11-May. Technically, this level is a daily chart uptrendline support for several months. It would be a significant level. From that level gold would stop falling and it would probably rebound. On the other hand, if gold violates the uptrendline to downside, more sellings can be expected.
If you are interested in you can request previous detailed analysis for each day during week. Please email to services@globalmarketwatch.biz
We will present you more reviews this weekend.
|