| Daily Commentary |
|---|
 |
|
|
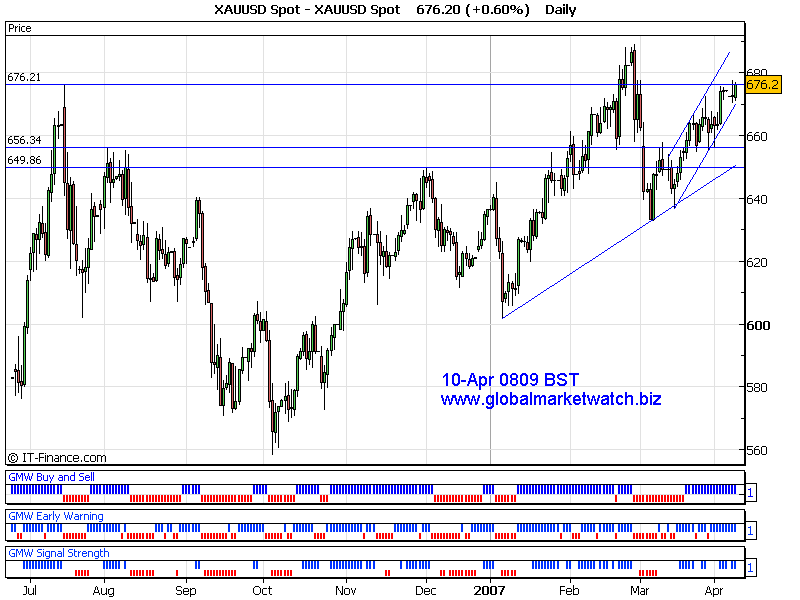
Gold has been in a sideways range between 671 and 677 for a few days due to low trading activities during the holiday period. All daily and short term are showing strong up at the time of analysis. Current near term support will be around 673 and resistance area would be at 677. Short/Medium term resistance will be at 682 and support will be around 669. Current trend is bullish at the time of analysis. Key levels to watch are 677 to upside and 672 to downside. Possible upside target would be around 682 and downside target can be around 669 if near term support and resistance levels are violated. P.s. Click here for samples detailed analysis. Good Luck! Thanks for listening! Gold Trader
p.s We are arranging to give away some classic Robert Prechter's Elliott Wave Principle Books. More information will be posted on our main website soon. |
|
I have also posted the signals on my main web site in the individual chart page. For subscription based analysis sample, you can find it in "Samples" page of my main website. For Elliott Wave International's Commentary, please visit here! Trading Platform to trade gold, silver and forex => Click Here |
|
|
|